Getting Started#
This page walks you through signing up, finding your way around, planning your first dive, and logging it afterward. If you've dived the Pacific Northwest before, most of it will feel familiar — the interface is doing the same planning you already do, just faster and in one place. If you're newer to diving here, the same flow works for you; the briefings are designed to be readable without local-knowledge prerequisites.
What's in the sidebar#
Before signup, a quick map of where things live. The left-hand sidebar is the same on desktop and mobile (a hamburger menu opens it on smaller screens), and it's the only navigation you need.
- Plan a dive — the planning wizard. Pick a site, pick a date, get a full briefing. This is where most sessions start.
- Plans — every briefing you've explicitly saved. Open one to re-render the briefing for that site and date with the latest NOAA pull plus the applied delta value that was active at save time.
- Log a dive — record a dive after it happens. The slack delta you log here is the signal that feeds the site-specific correction engine if you opt in to share.
- Dive history — browse your past dive logs.
- Slack analysis — fleet-level view of how predictions stacked up against your logged dives.
- Community — aggregated correction signals from divers who chose to share, and the toggle that opts your own logs in or out.
- Docs — what you're reading now.
- Settings — account, units (feet vs. metres, knots vs. mph), and the global community-sharing toggle.
At the bottom of the sidebar:
- Send feedback — opens a small modal for bug reports, station-pairing concerns, or general notes. Goes straight to the developer. This is not where you log dives.
- Sign out — sign out.
The two reporting surfaces are separate on purpose. Log a dive captures structured per-dive observations that feed the correction engine. Send feedback is for everything else — bugs, missing sites, predictions that seemed off but you don't have a logged dive for, anything you'd tell me about in person.
1. Sign up#
Head to the sign-up page and create an account with an email and password. You'll get a verification email within a minute or two — click the link to activate. If it doesn't show up, check spam; the sender is a transactional address, not a mailing list.
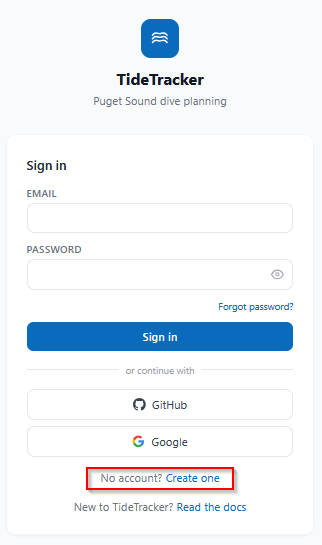
Password reset and email verification both run through the same flow, so if you ever get locked out, the "forgot password" link will get you back in.
After verifying your email, you'll land on your dashboard summary — a greeting, a few quick stats, and shortcuts into the planner and the dive log. From there, click Plan a dive in the sidebar to start the planning wizard.
2. Plan a dive: pick a site#
The Plan a dive wizard has three steps: Site → Date → Briefing. Step 1 is the site selector. The wizard opens with all regions visible — the region pills at the top filter the grid down once you click one.
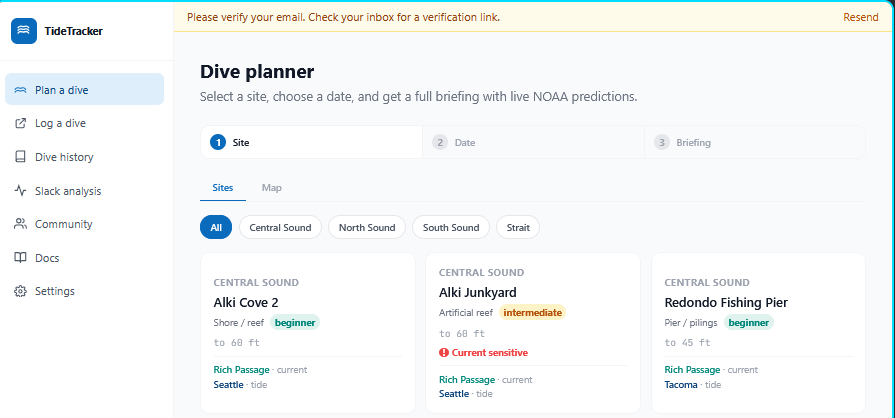
The site grid is the default view, and it's usually the fastest. Each card shows the site name, region, type, skill level, depth, the assigned current and tide stations, and the correction status: a coloured "applied delta" badge once the site has at least 10 logged observations, or a n/10 · correction pending note while it's still accumulating.
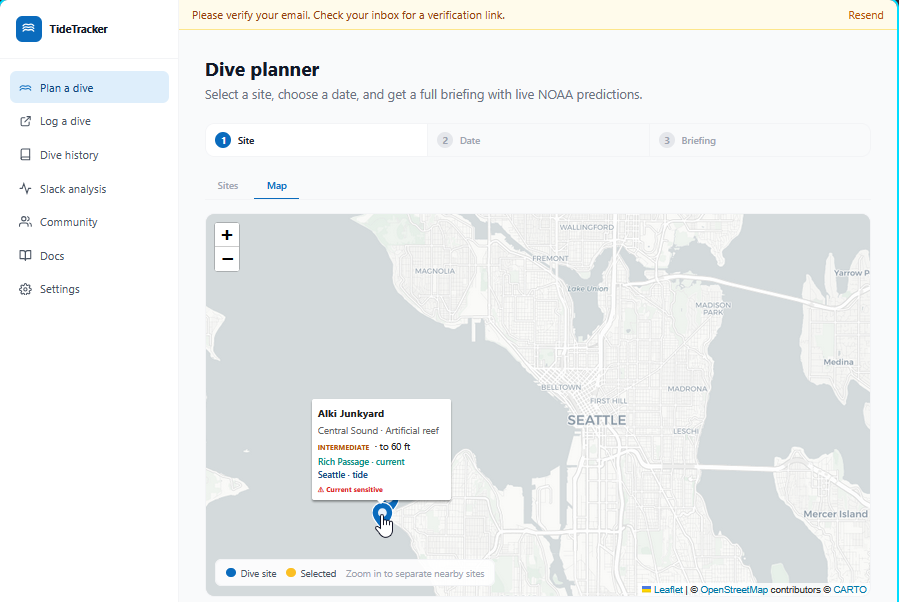
If you'd rather see sites geographically, switch to the Map tab. The map is Leaflet-based, plots every loaded site, and lets you click a marker to advance to Step 2.
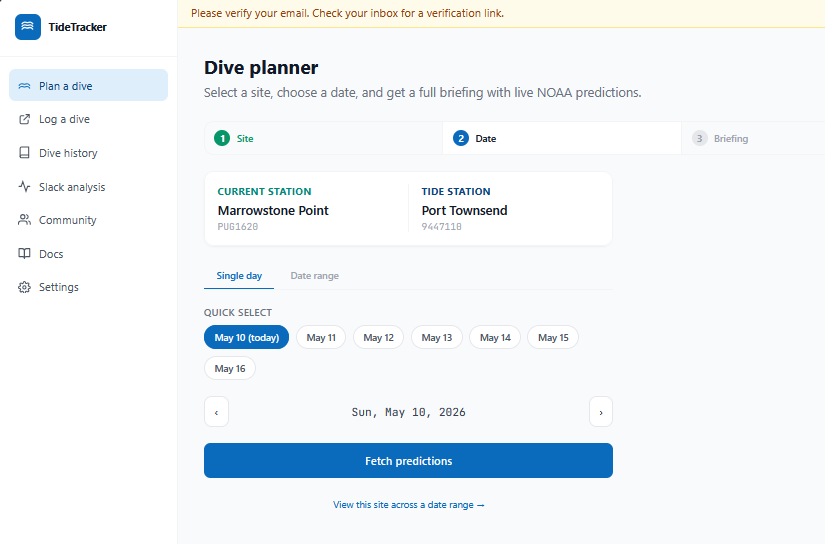
Once you've selected a site, Step 2 opens with the site's full station mapping — current station, tide station, NOAA IDs and all. For example, Alki Junkyard pulls its current data from Rich Passage (PUG1501) and its tide data from Seattle (9447130). You don't have to memorize this, but it's there if you ever want to know exactly where a number came from.
3. Plan a dive: pick a date#
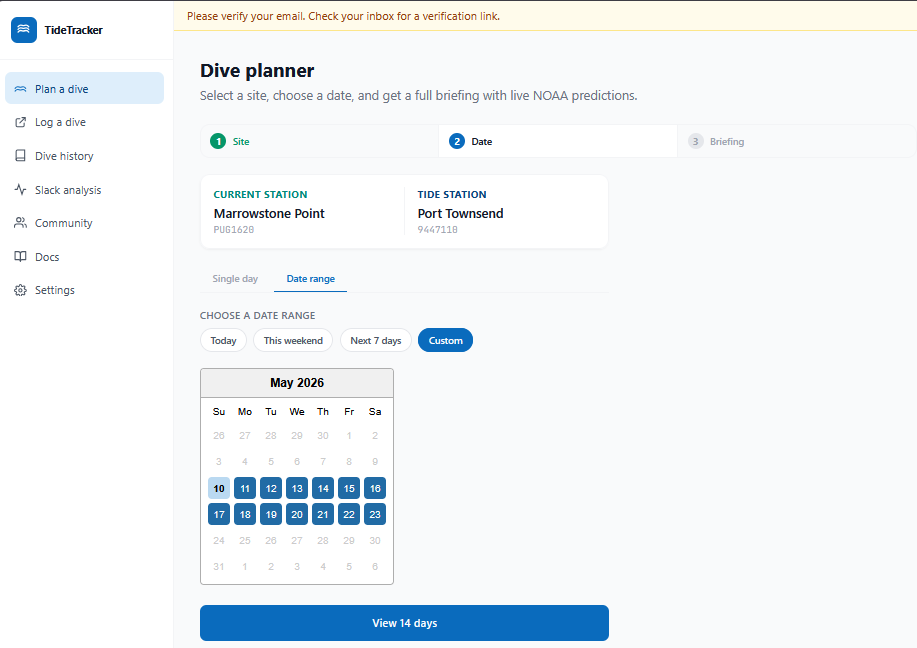
Step 2 is the date selector. It has two modes, toggled with a tab — single day is the default for everyone; range mode is opt-in.
Single day. A row of Quick select chips covers today and the next six days, plus a pair of prev/next arrows for stepping further out. Click a chip and hit Fetch predictions. A "View this site across a date range →" affordance below the button is the discoverable opt-in to range mode if you want to scan a week at a glance.
Date range. Range mode opens with preset chips covering the common cases: Today, This weekend, Next 7 days (preselected by default), and Custom. The preset chips are one-tap — pick one and hit View N days. Custom reveals a calendar grid where you can pick any start/end up to 14 days apart.
Once a range is fetched, you land directly on the Briefing for one day in the range — today if it's in the range, otherwise the first day. At the top of the Briefing, a horizontally scrollable day-strip shows every day in the range with a 0–100 composite score and a colored Best / Good / Marginal / Poor tier. Tap any day to swap the Briefing focus to that day — no extra fetch, the data was already loaded.
Day scores weight slack timing inside daylight (heaviest), reasonable-hour windows, current speed at slack, slack duration, and tidal exchange. Per-site tuning means a "Best" day at Salt Creek looks different from a "Best" day at Edmonds — sites with consistently strong currents at slack get scored against a different yardstick than sites where slack is reliably slack. Treat the score as a starting point, not a verdict; a high-scoring day is worth opening the briefing for, a low-scoring day is worth looking harder before committing.
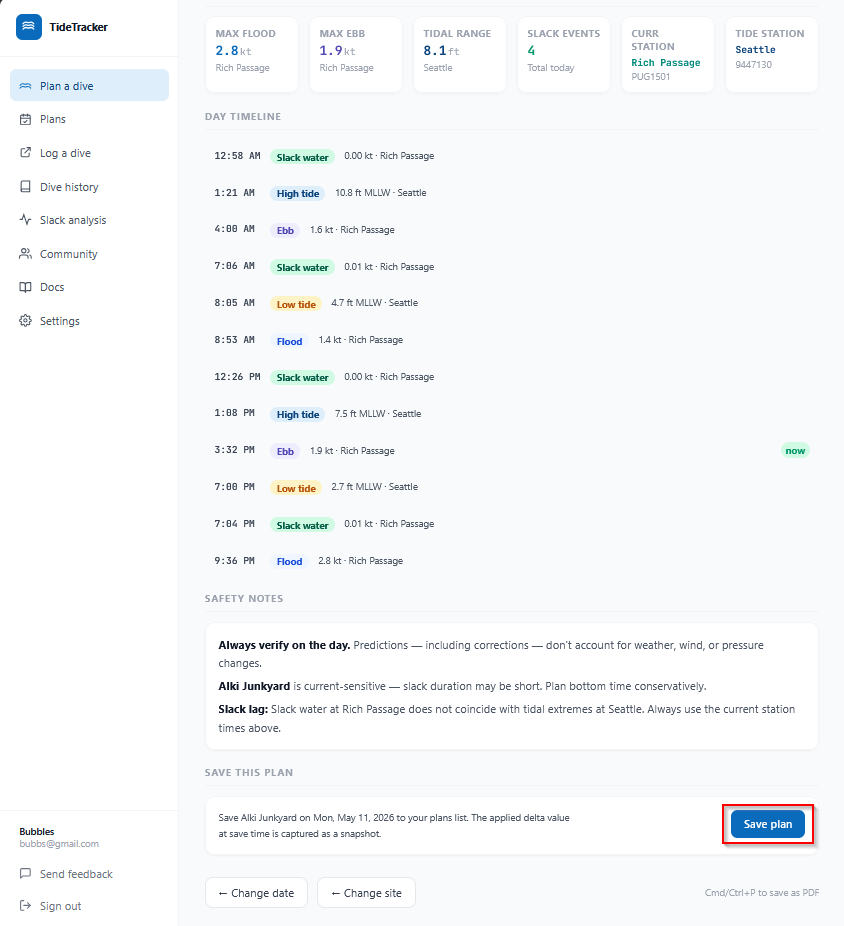
4. Plan a dive: read the briefing#
Step 3 is the daily briefing. Here's what you're looking at:
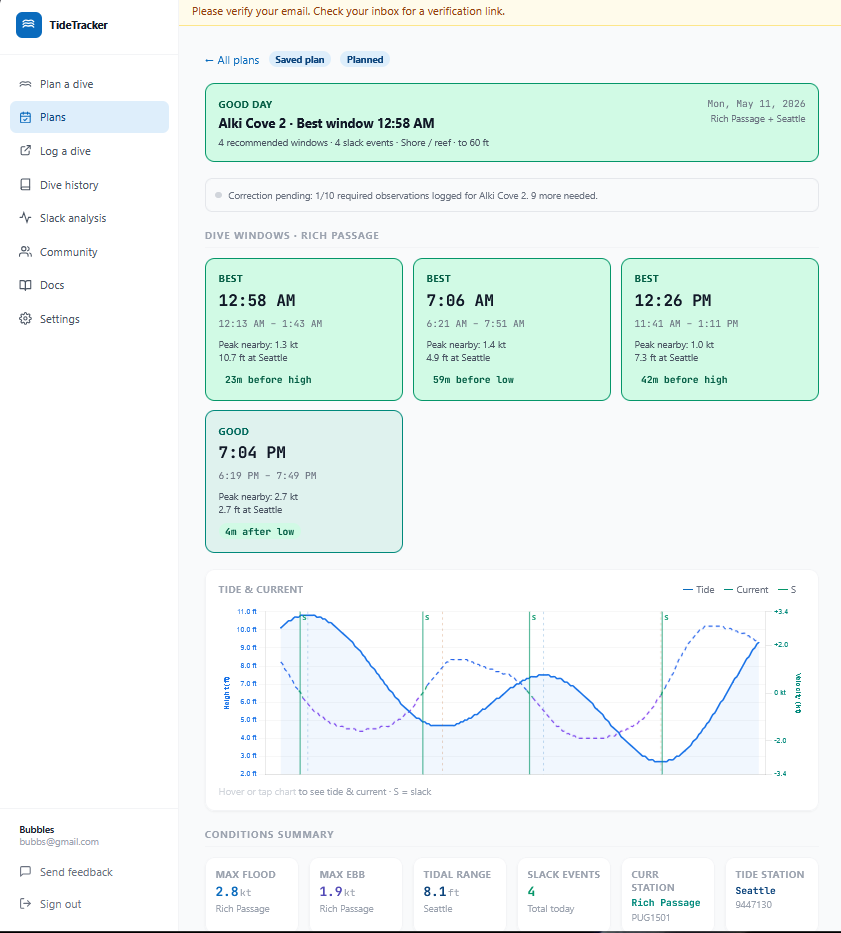
Slack windows. Each slack event from the current station gets its own card with a window quality badge: Best, Good, Marginal, or Skip. This is the finer-grained signal you actually plan around — a day rated "Good" overall might have one Best window in the morning and a Marginal one in the afternoon. When a site has an active correction, the window times show the corrected slack with the original NOAA prediction struck through underneath.
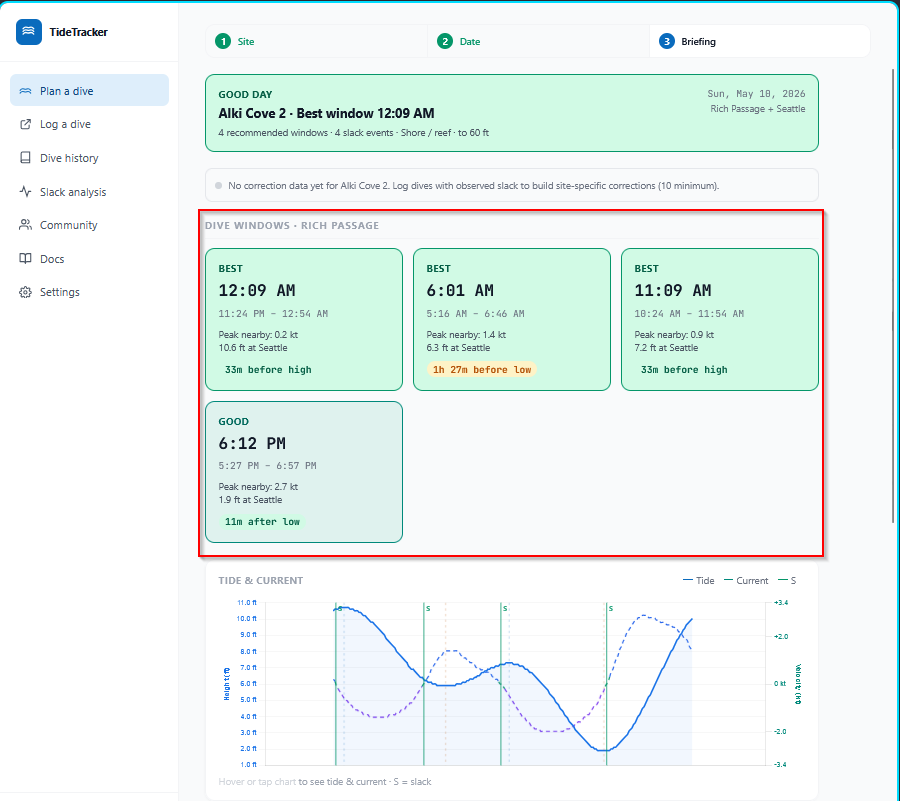
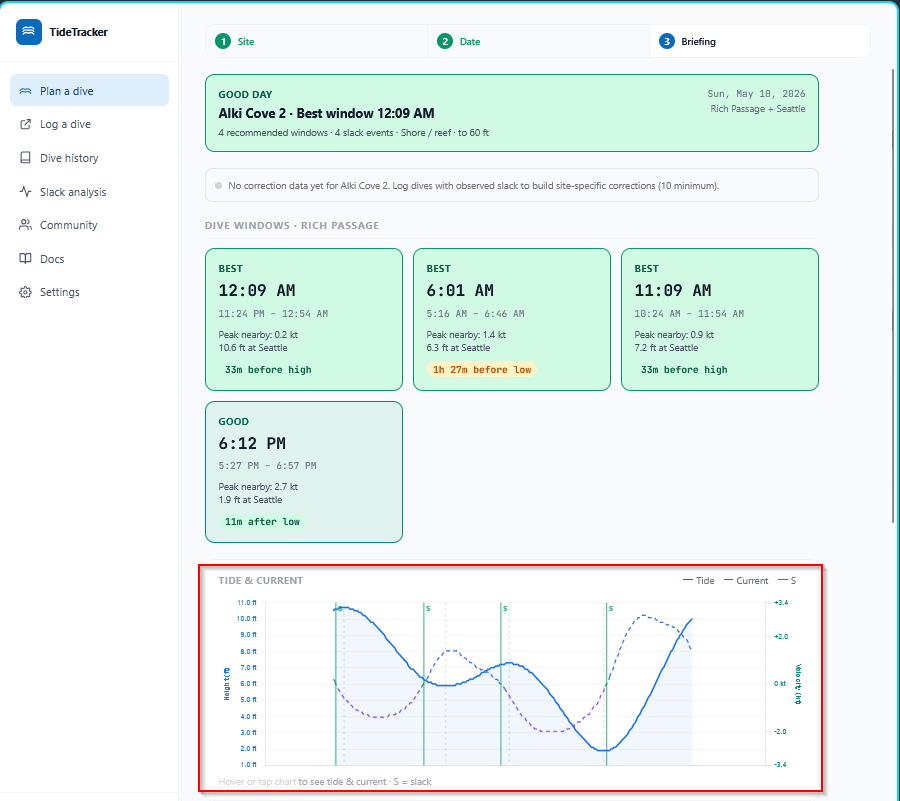
Tide and current chart. Predicted water level and current velocity across the day, with slack events marked. Sourced from the site's NOAA stations and corrected where applicable.
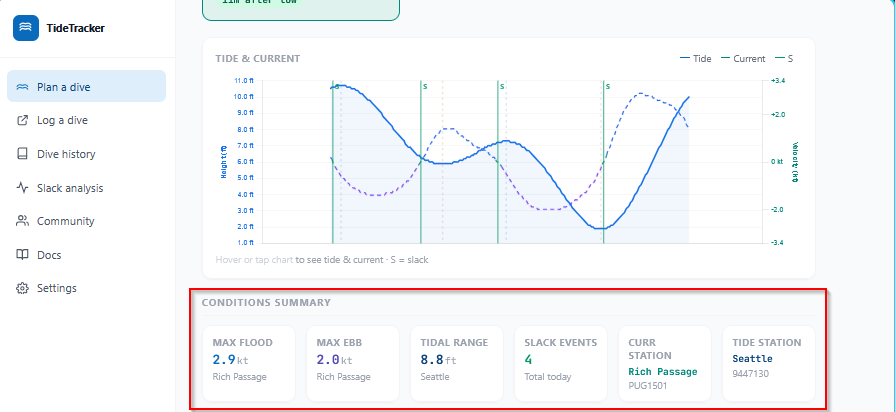
Conditions summary. Max flood, max ebb, tidal range, slack count for the day. Each metric is tagged with the NOAA station it's drawn from, so you can see which station is driving which number.
Confidence and staleness. A site needs at least 10 logged observations before any correction is applied at all. Below that, the briefing shows "No correction data yet" (zero observations) or "Correction pending: n/10 required" (one to nine), and no confidence badge appears. Once a correction is active, the badge tracks how much evidence sits behind it: Low (10–19 observations), Moderate (20–49), High (50+). Each site also shows when its correction was last updated; sites that haven't received new observations in 12 months are flagged Stale. Together, these tell you how much trust to put in the prediction beyond the raw NOAA pull.
The briefing is designed to be parseable in the time it takes to drink coffee. If you're finding yourself puzzling over what a chart is telling you, that's a bug — let me know via Send feedback.
5. Save a plan to come back to#
Most sessions, the briefing is all you need — read it, decide whether to dive, close the tab. When you do want to keep one, scroll to the bottom of the briefing and hit Save plan. The plan stores the site, the date, and a snapshot of the applied delta value that was active for that site at save time. Notes are optional and can be added later.
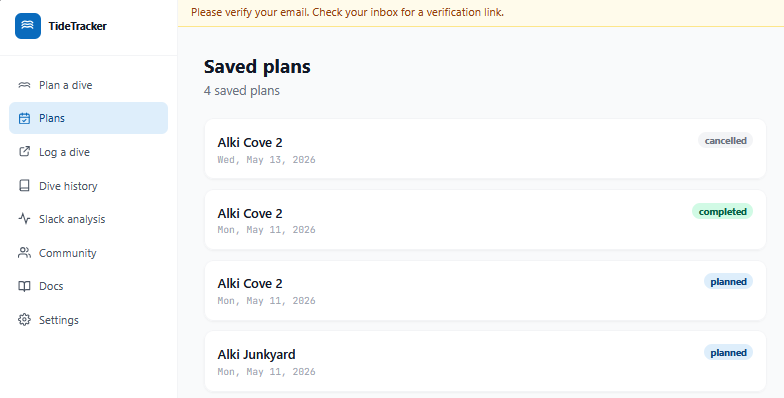
After saving, the button swaps to View saved plan → with a link straight to the detail page. The plan also lands in the Plans sidebar entry, sorted with the most recent date first. Each row shows the site, date, status, and a short notes preview if you've added any.
Open a plan to land on the detail page. The briefing is re-rendered live — TideTracker pulls the current NOAA predictions for the saved site and date and recomputes windows, the chart, and the timeline against today's correction state. The applied delta snapshot from when you saved is shown in the header strip; if the site's correction has shifted since then, the rendered briefing reflects the current delta, not the snapshot. The snapshot is there so you can see what the planner was suggesting at the moment you committed to the plan.
You can edit notes inline at any time (max 500 characters) and delete a plan with the button at the bottom of the detail page. Date editing is intentionally off — if a plan slipped to a different day, save a new one. Plans start in the planned state and transition to completed automatically when you log a dive from them, or to cancelled with the manual action on the detail page. The "Log this dive" handoff is covered in Section 6.
6. Log your dive after the trip#
After your dive, the most useful thing you can do for the app — and for every other diver who comes after you — is record what you saw. You do that at Log a dive in the sidebar (route: /dashboard/log).
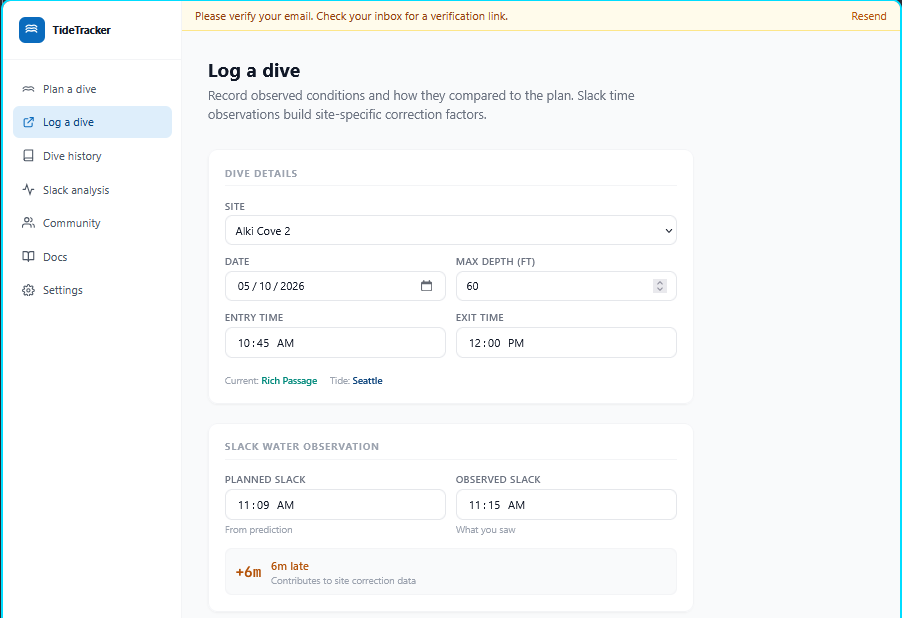
The form has four sections, top to bottom:
- Dive details — site (from the same list as the planner), date, max depth, entry and exit times. Picking a site here also pins the dive log to the same NOAA stations the planner used.
- Slack water observation — this is the field that feeds the correction engine. Enter the planned slack from the prediction you used, plus the observed slack you actually saw. The form computes the signed delta automatically — for example, observed 2:53 against planned 2:47 reads as
+6m late. That delta is what gets aggregated across divers to refine the per-site applied delta. - Observed conditions — visibility, water temp, conditions vs plan (better / as-predicted / worse / no-prediction-to-compare), and a current strength slider with five steps: None / Mild / Moderate / Strong / Dangerous.
- Plan accuracy & notes — a one-to-five-star rating ("How accurate was the dive plan?") and a free-text notes field for anything the numbers missed.
Be honest, not precise. A rough slack time from a real dive is more useful than nothing, and the IQR-filtered correction math is built to absorb individual outliers without breaking the site's signal.
What feeds the correction engine today#
Only the slack delta currently feeds the per-site correction engine. Current strength, plan accuracy, and conditions vs plan are persisted on your dive log and surface in your own Slack analysis and history pages — but the engine doesn't aggregate them across divers yet. Wiring those signals into the correction engine is on the roadmap; the data is being captured now so it's ready when the engine grows to use it.
The Share with community checkbox#
At the bottom of the form is a Share with community checkbox.
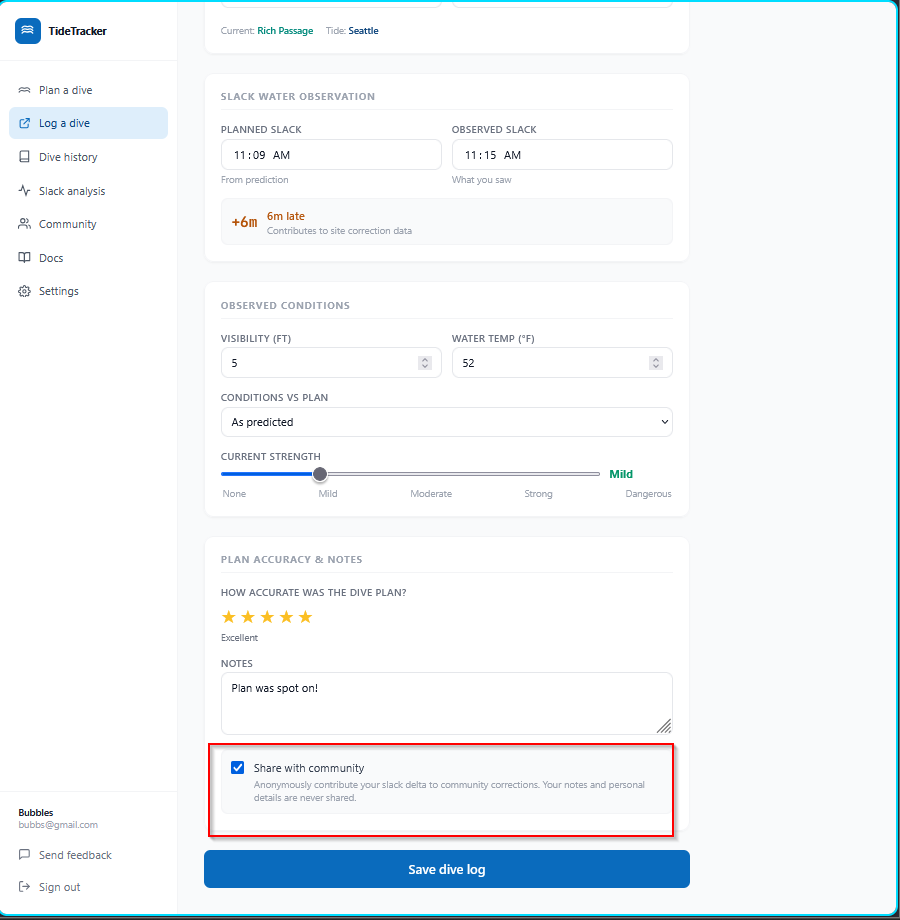
This is the most important toggle on the page. The in-app helper text says it directly: "Anonymously contribute your slack delta to community corrections. Your notes and personal details are never shared." Without this checked on a given dive, the log helps you — it shows up in your history and slack-analysis stats — but it does not contribute to the community correction aggregates other divers see.
There is a second key. Settings (sidebar) carries a global community-sharing toggle at the account level. Both have to be on for a dive log to feed corrections: the global toggle in Settings, and the per-dive checkbox at the bottom of the log form. If the global toggle is off, individual checkboxes don't matter — your logs stay on your record only. If the global toggle is on but you forgot to check the per-dive box, that one specific log doesn't contribute either.
This is deliberate: privacy-by-default at the account level, with explicit per-dive consent on top. Notes, exact times, max depth, water temp, and visibility never leave your record under any circumstance — only the slack delta is shared, and only when both keys are flipped.
Why bother#
If a site's confidence is Low or its corrections are flagged stale, your report counts for even more — those are the sites where new observations move the engine most. Even a few minutes after a dive contributes a real signal: the IQR-filtered math is designed to keep the middle of the distribution and shrug off the edges, so honest imprecision is fine.
For more on how reports get aggregated and the trust model behind them, see the Community page.
Troubleshooting#
- Didn't get a verification email. Check spam; allow a few minutes. If still nothing, use Send feedback.
- Can't sign in after signing up. If you recently switched between the live app and a development build, clear cookies for the site and try again.
- A prediction looks obviously wrong. Send feedback with the date, site, and what you saw. If it lines up with a dive you actually did, log it through Log a dive instead — that's the surface that feeds corrections.
- A site I dive isn't listed. Send the name through Send feedback and I'll add it.
- I logged a dive but my report doesn't seem to be feeding corrections. Check both the global community-sharing toggle in Settings and the per-dive Share with community checkbox on the dive log. Both must be on. If only one is on, the log stays personal.